Charting Range Vectors in Prometheus
In the previous blog post, we mentioned that Range Vectors cannot be charted. This blog post illustrates how we can work around the limitations and use Range Vectors in charts. We will also take a look at the actual Prometheus API and how it affects the visualization of these queries.
Prometheus has two API endpoints that accept PromQL expressions and return timeseries information. A high-level distinction between the two is as follows:
| Instant Query | Range Query | |
|---|---|---|
| Endpoint | /api/v1/query |
/api/v1/query_range |
| Time Input | Single Timestamp (time) |
Range (start, end) |
query Type |
Instant or Range Vector | Instant Vector only |
resultType |
vector or matrix |
matrix only |
| Viz Type | Gauge, Stat or Table | Timeseries, Line or Column Chart |
Both the HTTP Query APIs return timeseries information in the form of JSON data structures.
This data structure can be of two possible formats, as per by the resultType field.
A vector is essentially a 2-tuple of the form [timestamp, data-point].
Further, a matrix is just an array of these vectors.
The other types such as scalar and string are primitive, so we’re ignoring them for now.
/api/v1/query |
/api/v1/query_range |
|
|---|---|---|
| Instant Vector | vector |
matrix |
| Range Vector | matrix |
error |
The above table shows how vector and matrix result types can represent different things, depending on the endpoint and the type of the input PromQL expression.
These formats are a bit general in nature and will appear in different cases as appropriate.
Even though named similarly, a vector by itself has got nothing to do with Instant Vectors or Range Vectors; it is just the on-the-wire format.
Instant Queries
Instant Queries are the simplest way to query timeseries information.
it evaluates a PromQL expression for a single instant in time.
The given PromQL expression can be either a Range or an Instant Vector.
The time parameter is a single timestamp for which the expression will be evaluated.
When using a tool like Grafana, we will usually render an Instant Query as a Gauge or a Stat panel. This is because these panels are intended to display individual values at a specific instant in time. There is usually no time ‘period’ accompanying these values. When configuring the Prometheus target in the Grafana UI, we need to ensure that the ‘Instant’ switch is toggled on. Otherwise the Range Query API is used by default.
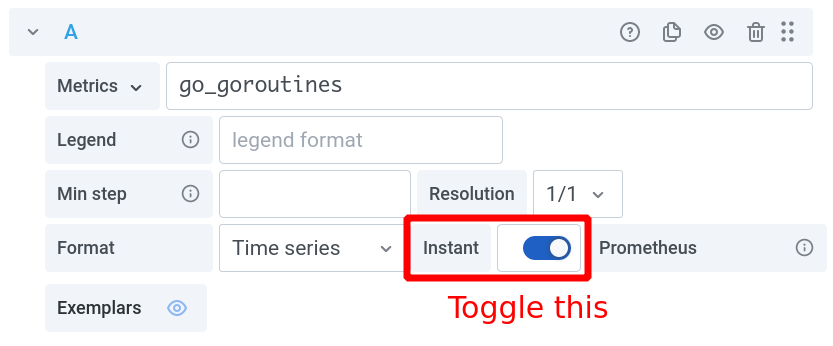
Once turned on, Grafana will call the Instant Query endpoint with the PromQL query and the “To” timestamp as the time parameter.
For example, the below gauge represents the count of Goroutines at 14:20 on 2021-06-09.
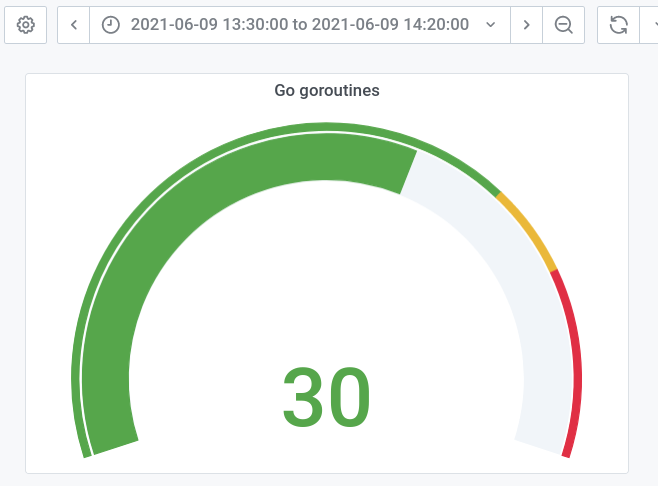
Since the number of Goroutines is a gauge, the PromQL query will be an Instant Vector.
The result will be a vector, since a single datapoint is expected as the output.
curl 'http://localhost:9090/api/v1/query' \
  --data 'query=go_goroutines' \
  --data time=1622794156
{
  "resultType": "vector",
  "result": [
    {
      "metric": {"__name__": "go_goroutines"},
      "value": [1622794156, "30"]
    }
  ]
}
If we want to look at a range of values ending at the current time, we can use a Range Vector query.
In such a case the response will have resultType set to matrix, since multiple data points are expected in the result.
This structure represents the data points upto a duration in the past, as specified by the range selector [1m].
curl 'http://localhost:9090/api/v1/query' \
  --data 'query=go_goroutines[1m]' \
  --data time=1622794156
{
  "resultType": "matrix",
  "result": [
    {
      "metric": {"__name__": "go_goroutines"},
      "values": [
        [1622794096.009, "31"],
        [1622794111.009, "31"],
        [1622794126.009, "32"],
        [1622794141.009, "32"]
      ]
    }
  ]
}
Since the query is of type Range Vector, we have a timeseries embedded in the result of the Instant Query. Grafana will promptly chart this for us, if the chosen visualization supports it.
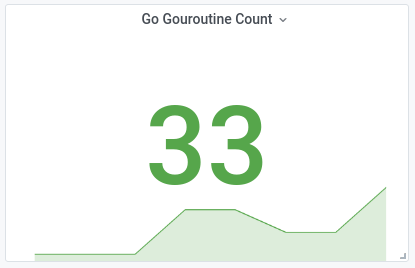
This may seem to contradict the previous blog post where we mentioned that Range Vectors cannot be charted; but that only applies for Range Vectors evaluated over a range of time. Since this is an Instant Query, the PromQL expression is evaluated at a single instant in time making the chart possible. Also note that this also makes use of Grafana’s extensive control knobs. The built-in Prometheus UI does not seem to be designed to chart a Range Vector.
Range Queries
Instead of a time field, the Range Query API takes in a step duration along with a start and an end timestamp.
It performs an operation equivalent to calling the Instant Query API for each step of the interval between start and end.
curl 'http://localhost:9090/api/v1/query_range' \
  --data 'query=http_requests_total' \
  --data start=1622803680 \
  --data end=1622803800 \
  --data step=10s
{
  "resultType": "matrix",
  "result": [
    {
      "metric": {},
      "values": [
        [1622803680, "1253"],
        [1622803690, "1254"],
        [1622803700, "1255"],
        [1622803710, "1255"],
        [1622803720, "1257"],
        [1622803730, "1268"],
        [1622803740, "1268"],
        [1622803750, "1272"],
        [1622803760, "1273"],
        [1622803770, "1273"],
        [1622803780, "1274"],
        [1622803790, "1276"],
        [1622803800, "1276"]
      ]
    }
  ]
}
The on-the-wire format of a Range Query is always a matrix, since we’re expecting a data point for each step.
The most common visualization for this timeseries information is a line or a column chart.
It can be charted trivially by Grafana or the built-in Prometheus UI, as there is exactly one data point per timestamp.
If we’re charting a gauge metric, we can call our job done.
However, if we see a weird ‘ever-increasing’ chart like the one below, we have a monotonically increasing counter on our hands.
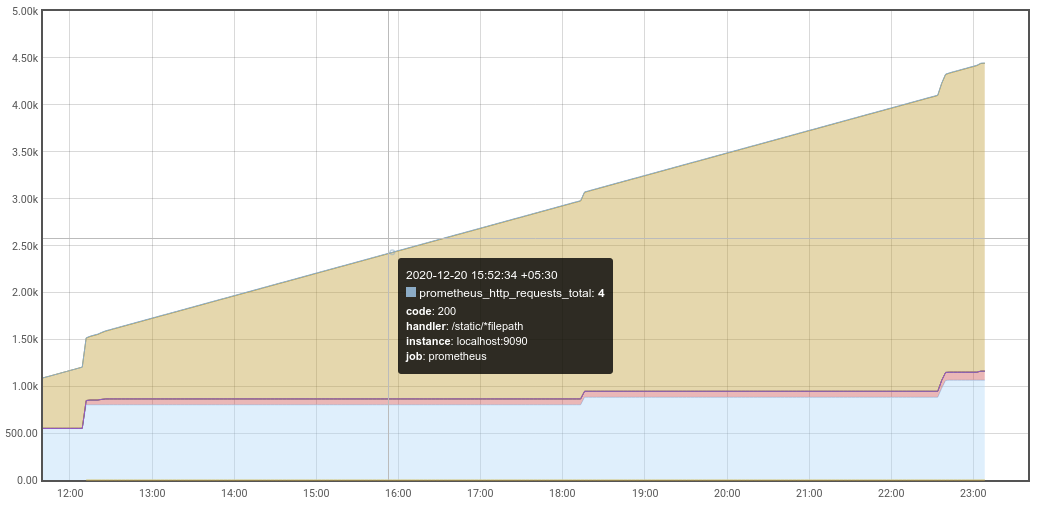
Charting changes in a counter is a common use-case for Range Queries, so let’s try to fix the naivety in the above chart.
We may remember from the previous post that if we want to see the change in counter values, we need to use a Range Vector.
But we cannot blindly append a range selector like [1m] as that still doesn’t give us the ‘change’.
In addition, it will also be rejected with a 400 Bad Request.
curl 'http://localhost:9090/api/v1/query_range' \
  --data 'query=http_requests_total[1m]' \
  --data start=1622798876 \
  --data end=1622802476 \
  --data step=1s
{
  "status": "error",
  "errorType": "bad_data",
  "error": "invalid expression type \"range vector\"
            for range query, must be Scalar or instant Vector"
}
The above error is what someone has in mind, when they say that a Range Vector cannot be charted.
The API literally rejects a Range Vector query as input.
This makes sense because there is no well defined way to represent or chart multiple data points for each timestamp in a series, over a period of time.
Thus any query that we want to chart over a range of time, must be of type Instant Vector and have an on-the-wire format of matrix.
To correctly render change in the counter value over a period of time, we’ll need to use a Range Vector function like increase(...).
It computes the increase in requests over each range bucket and then returns the result as an Instant Vector.
curl 'http://localhost:9090/api/v1/query_range' \
  --data 'query=increase(http_requests_total[1m])' \
  --data start=1622798876 \
  --data end=1622802476 \
  --data step=10s
{
  "resultType": "matrix",
  "result": [
    {
      "metric": {},
      "values": [
        [1622803680, "5.333333333333333"],
        [1622803690, "5.333333333333333"],
        [1622803700, "5.333333333333333"],
        [1622803710, "5.333333333333333"],
        [1622803720, "5.333333333333333"],
        [1622803730, "18.666666666666664"],
        [1622803740, "18.666666666666664"],
        [1622803750, "22.666666666666664"],
        [1622803760, "21.333333333333332"],
        [1622803770, "21.333333333333332"],
        [1622803780, "8"],
        [1622803790, "5.333333333333333"],
        [1622803800, "5.333333333333333"]
      ]
    }
  ]
}
The result now is an Instant Vector in the form of a matrix, where each 2-tuple of [timestamp, data-point] represents the increase in requests over that step.
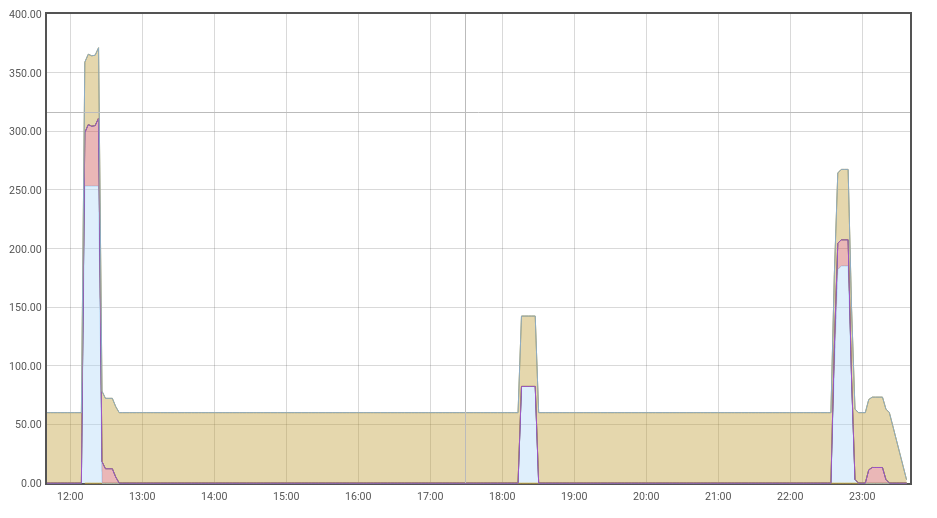
After charting the new query, we should see a ‘natural’ chart indicating that we’ve been serving roughly constant throughput over the period of time.
Hopefully, the above screenshots and explanation should give a basic idea of how Range Vectors can be charted. We also looked at the primary ways to query this information, depending on the kind of visualization. In my opinion both the Instant and Range Query APIs could have been named better. Being named so similarly, one is bound to (very wrongly) assume that Instant Vectors are related to Instant Queries and Range Vectors to Range Queries. In reality, the ‘range’ in “Range Query” is not the same as the ‘range’ in “Range Vectors”.
The built-in Prometheus UI is good for building intuition, but is very restrictive. I highly recommend playing around with Grafana, as it is the de-facto visualization tool in the industry. It has a lot of interesting helper variables that for range selectors and Range Query API parameters. We will take a deeper dive into these, in the next blog post.
